'Celtic Fields' – Archaeology's stepchildren
Traces of prehistoric farming in Western,
Central, Eastern and Northern Europe: Averaged virtual sections
Continue with:
Generating stereo graphics Back to: Obtain terrain
laser data Display terrain laser data
Interprete graphics
GIS and laser data evaluation programmes generally allow the creation of
arbitrary sections through an elevation data grid. However, such sections in
forests are usually particularly affected by data noise and thus rather useless.
A somewhat complex but very effective method has proven to be the averaging of
several parallel, equally spaced neighbouring sections. For 'Celtic Fields' with
their often around 10 m wide and only a few cm high boundary walls, a 10-fold
superelevation is generally recommended, in extreme cases even 20-fold. On
steeper slopes (where the tracks are usually more pronounced) a 5-fold
superelevation is usually sufficient, in extreme cases even less. The number of
individual cuts has proven to be 11, the spacing 1m. To determine the end points
of the partial sections I wrote the small programme SCHNITTE, which has to be
started via the Windows command line and returns a text file with the necessary
information as well as an XY file with the coordinates of the end points, which
can be read e.g. directly into Global Mapper and appears in the graphic as
points. Now the sections must be created in sequence and saved in Global Mapper
format as XZ files (reihe1.xz, reihe2.xz,....reihe11.xz). My second programme
GLSCHNITT reads these files together with the file generated by SCHNITTE and
outputs both an HPGL plot file with the averaged section and the entry of
distance and height value lines and an information text file with the name and
end points of the averaged section and the information on the distance and
height value lines. Some examples of sections at two locations follow.
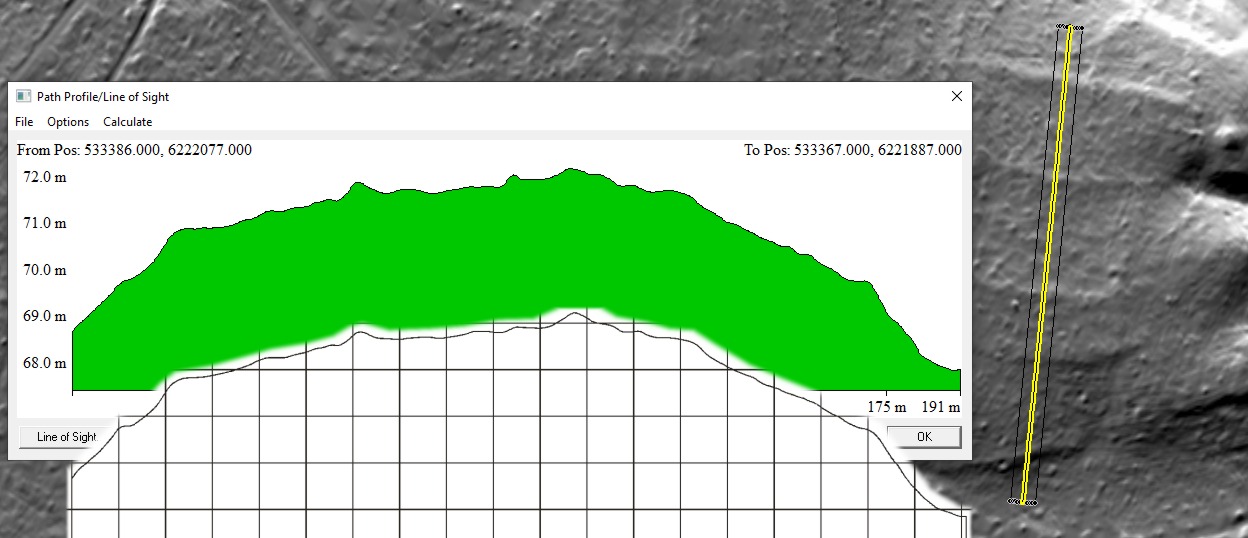
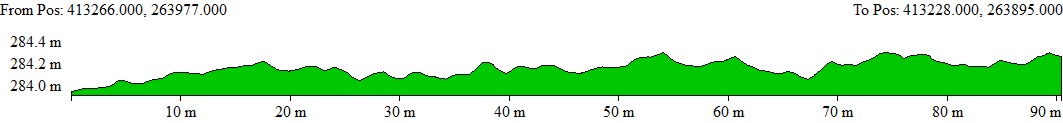
A north-south section through four parcel margins
in Silkeborg-Vesterskov, Jutland, Denmark, 10 times superelevated. The rough cut
on the central axis (green; directly from Global Mapper) shows irregularities
due to the forest background, which make interpretation difficult. The rough
HPGL plot file generated with GLSCHNITT with the already smoothed section is
superimposed. Most of the irregularities are clearly reduced, but the
southernmost parcel margin (right) appears somewhat flattened because it was cut
obliquely.
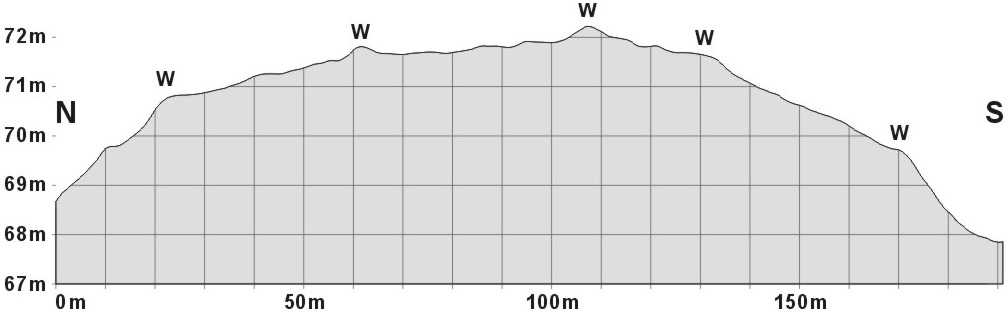
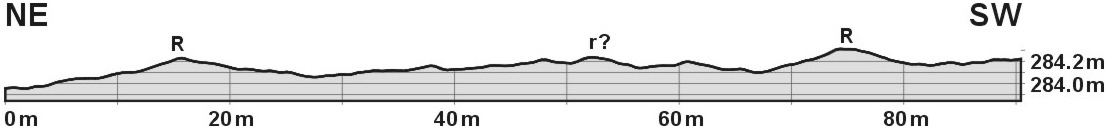
The same section in a publishable form. The graphic
preparation takes about as much time as the creation of the HPGL file. W:
Parcel rims
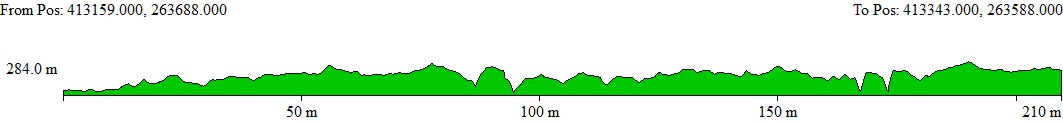
Section through two (weakly) chambered plots in Szczekotowo, Białowieza,
eastern Poland. Basis are already intelligently smoothed 2 m data; the raw 1 m
data show considerable data noise...
...as it becomes evident from this simple, unsmoothed cut through the raw data
and considerably complicates the data interpretation (10-fold exaggerated).
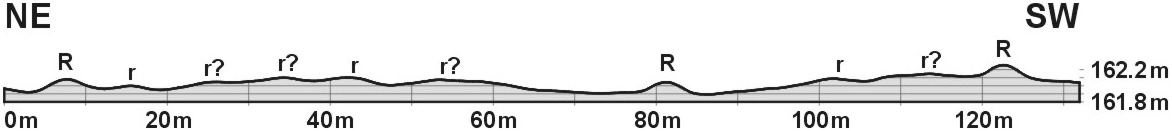
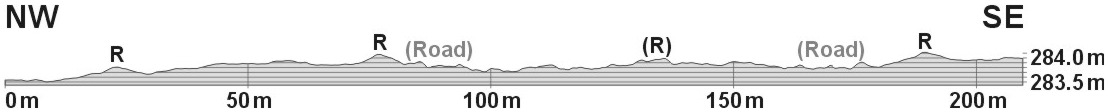
The section averaged with GLSCHNITT and graphically prepared shows edge ridges
of the superior plots (R) with a height of about 15 cm and a width of
about 6 m very clearly, while the chambering (r) is at best only
indicated in the section.
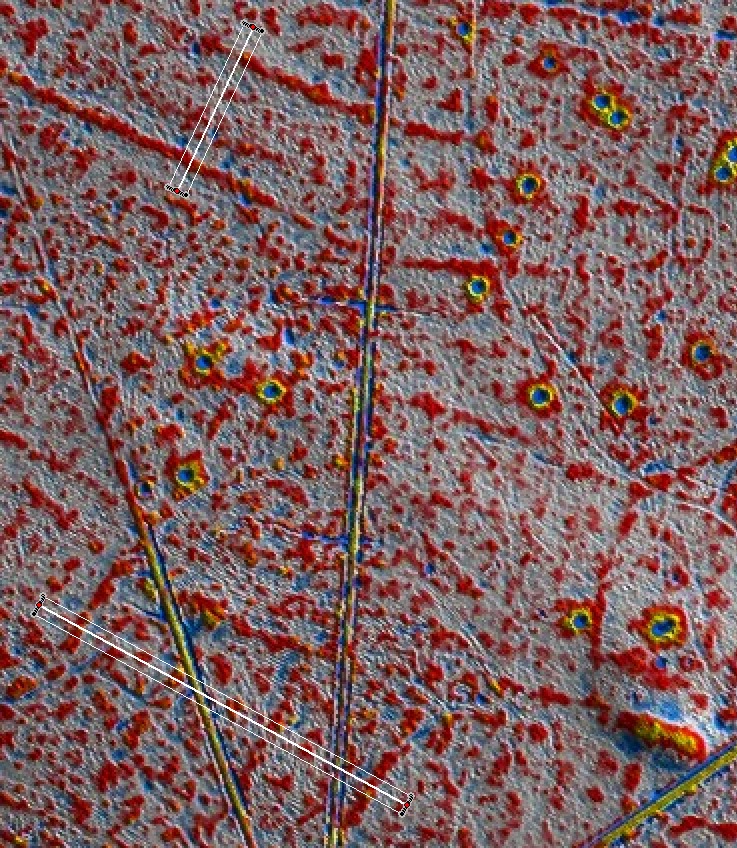
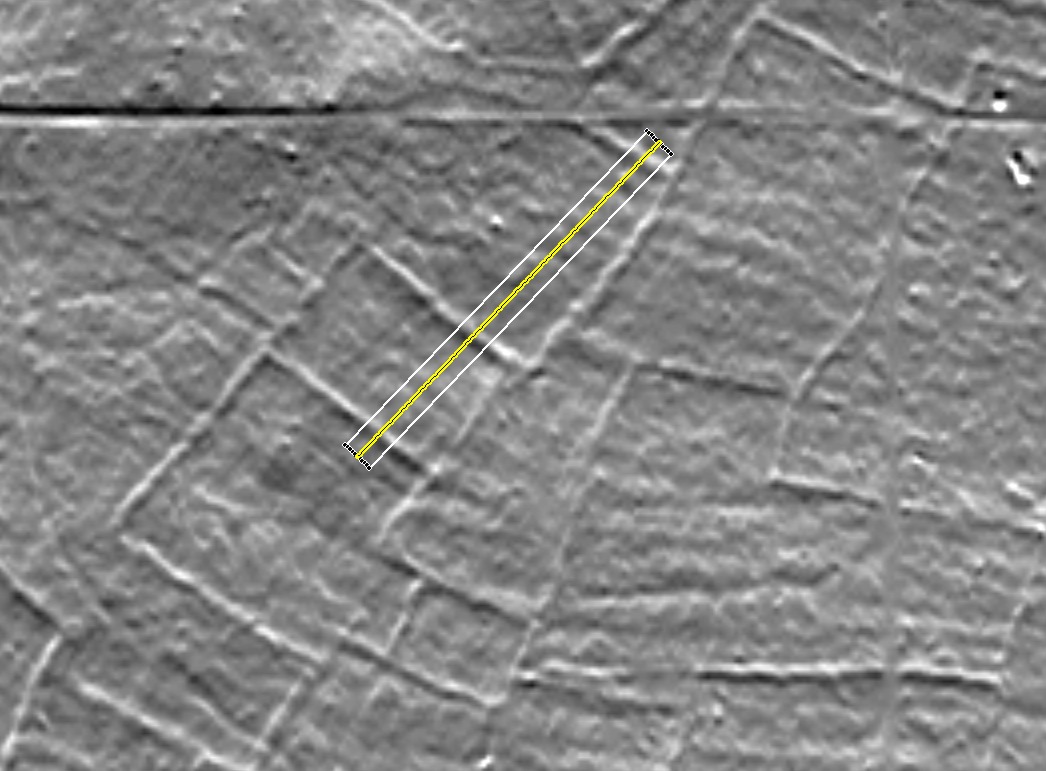
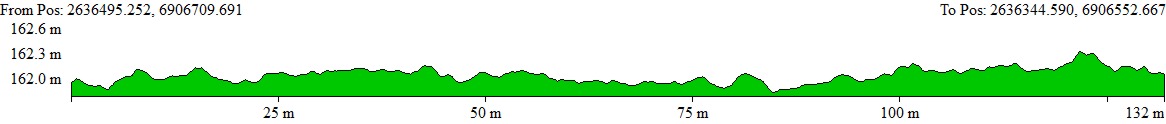
Two cuts in Glubczyce-Las Marysieńka (see also
Display laser data).
The upper cut runs through two boundary walls of a (superordinate) plot. Above:
single cut through 1-m-data, below: averaged cut. The plot rims are about 10 m
wide and 10-15 cm high.
The lower cut runs through three ( superordinate) plots. Above: single cut
through 1-m-data, below: averaged cut. The two diagonally cut current driveways
make themselves apparent as disturbances in the averaged cut.
More...
Back © Volker Arnold 2022