'Celtic Fields' – Archaeology's stepchildren
Traces of prehistoric farming in Western,
Central, Eastern and Northern Europe: Generating stereo graphics
Back to: Obtain terrain
laser data Display terrain laser data
Interprete graphics Averaged virtual sections
With an amazingly simple algorithm,
sterographic images, e.g. for red-green or red-cyan glasses, can be developed
from the laser data. These glasses can be purchased for little money on the net.
They always have to be put on over an existing pair of glasses. The necessary
conversions are done by the small self-written programme LASZUXYZ, which
requires an Arc-ASCII raster file of the data as input. Two XYZ text files are
output, one for the right and one for the left partial image. These must be read
back into e.g. Global Mapper in order to be able to output the partial images as
relief graphics in greyscale. The programme first calculates the mean height of
all data of the selected field and then, in a second step, the difference D
between the respective Z-value and the mean height for each raster point,
multiplied by a preset factor F. A new XYZ-value is then calculated for each
field, whereby D is added to the first X-value and subtracted from the second
X-value. The higher the factor D is selected, the stronger the exaggeration will
be. (The programme could easily be extended to the direct input of an XYZ data
set).
These two XYZ data sets, which the
programme saves with the additions G for green/left and R for red/right, must
then be converted back into raster data and should be output as greyscale relief
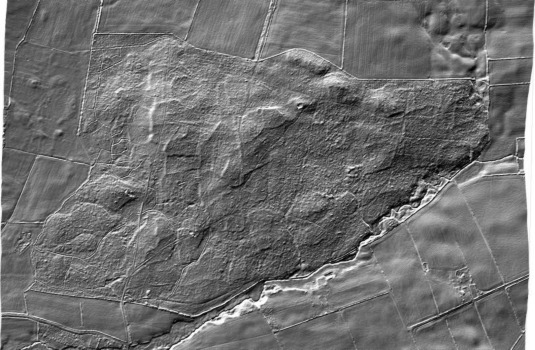
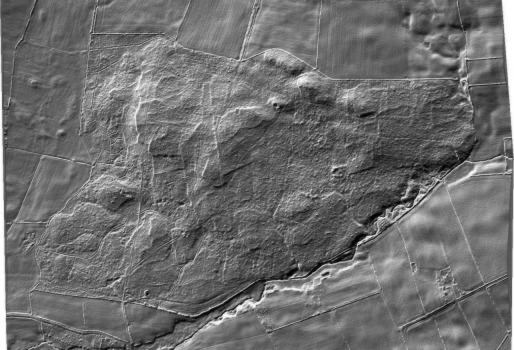
image files with hillshading not set too high. Here is an example of the 'Celtic
Fields' in the Elmholz in Anglia, Schleswig-Holstein:
|
 |
 |
|
Greyscale graphic for the left
eye |
Greyscale graphic for the right
eye |
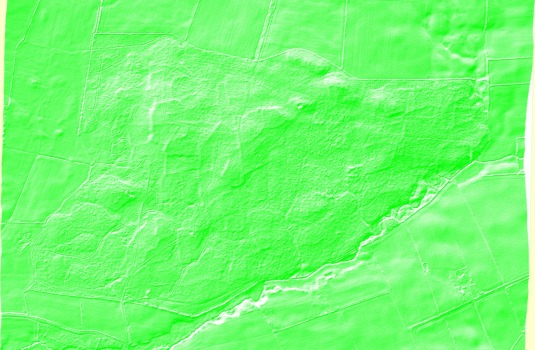
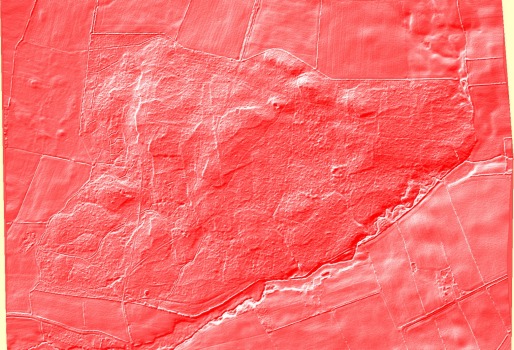
These greyscale images must then first
be converted to RGB mode (if necessary) using suitable image processing
software. Then each of the images must be divided into RGB colour channels.
In the case of the left G-image, the green channel must be set completely to
white (usually via the delete function or white colour fill), and in the
case of the right R-image, the red channel must be set accordingly. Finally,
the channels are merged again and saved with as little compression as
possible, resulting in the following image pair:
|
 |
 |
|
Green image for the left eye |
Red image for the right eye |
The same image processing software is then
used to superimpose these two partial images, setting either 50% coverage or
Multiply mode. The former will require an increase in contrast, the latter
usually an increase in gamma for general brightening. Finally, fade in the scale
if necessary. This is what the result looks like (with factor 3 selected):
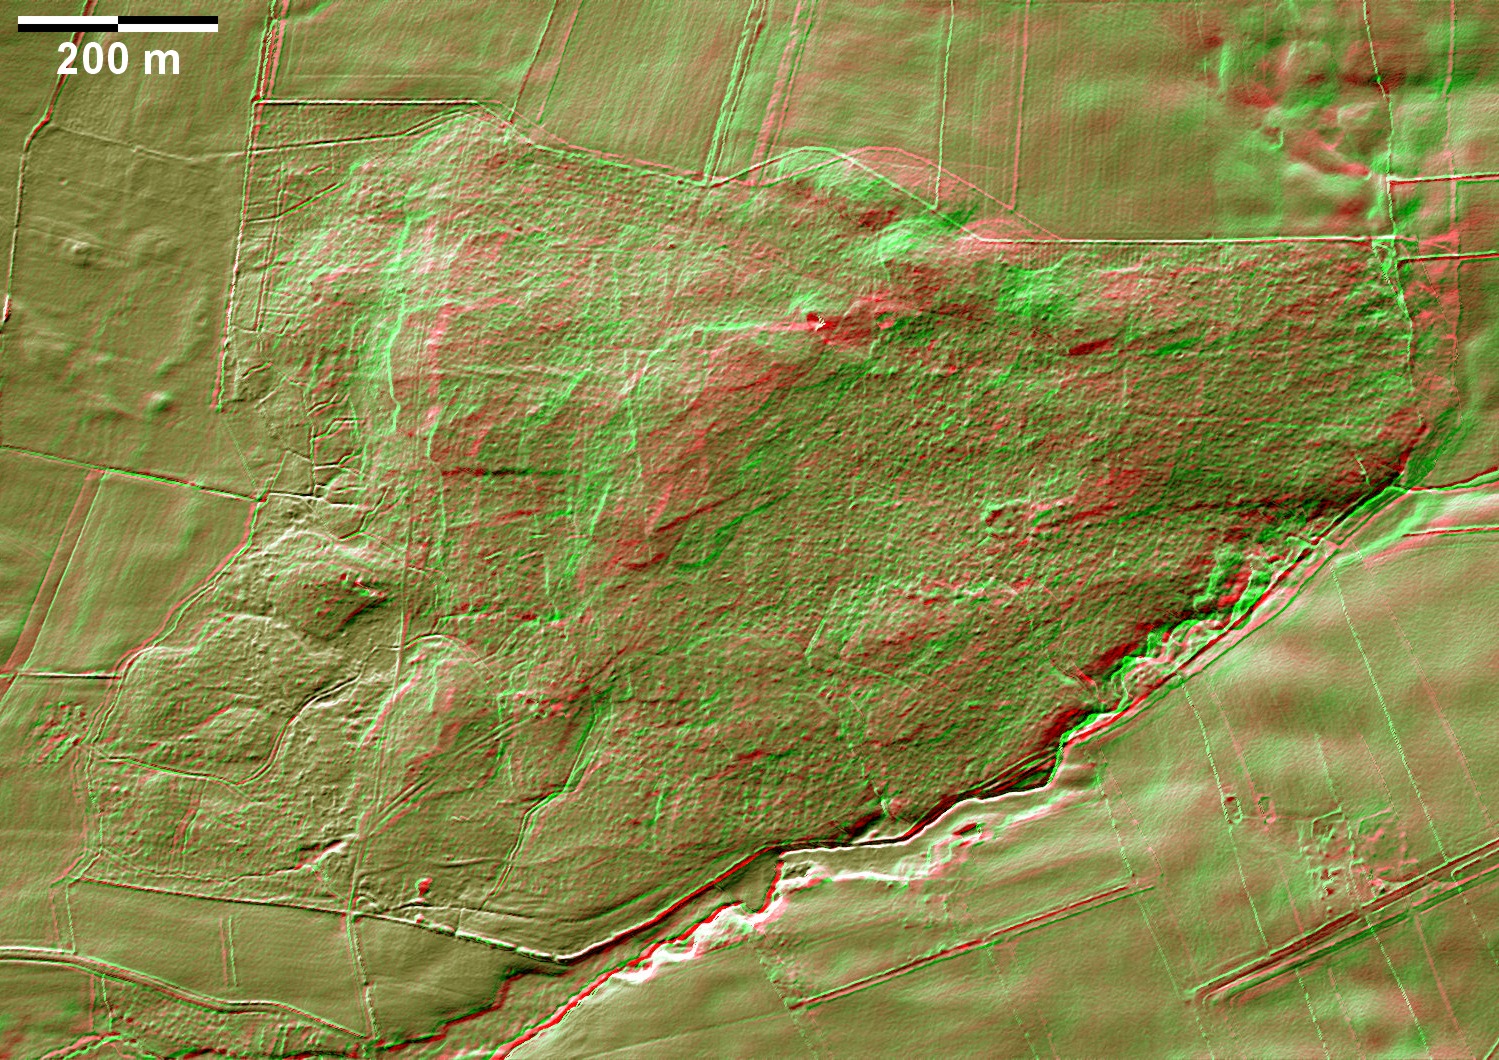
However, this graphic is only worth viewing
with red-green or red-cyan glasses, which should always be worn over any normal
glasses that may be required. If you are not used to this kind of viewing, you
have to give your eye (actually your brain) a lot of time. One notices that with
the factor 3 quite extreme "height differences" are already created, however
considerably lower values (0.5 below) do not really make the weak plot edge walls stand out:
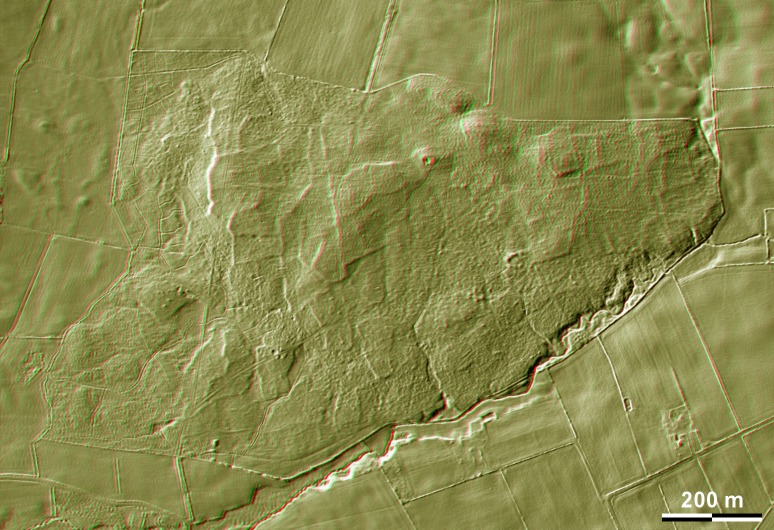
By the way: if you are red-green blind, you can still experience the stereo
impression! Only in the case of one-eyedness or the quite rare genuine inability
to see stereoscopically this kind of display is of no use.
Back to Start
Back © Volker Arnold 2022