'Celtic Fields' – Archaeology's stepchildren
Traces of prehistoric farming in Western,
Central, Eastern and Northern Europe: Interprete graphics
Continue with: Averaged virtual sections
Generating stereo graphics Back to: Obtain terrain
laser data Display terrain laser data
The interpretation of the graphics shown is
explained using the example of eleven sites, which has resulted in a rather long
web page. Those who already have some experience can skip a lot!
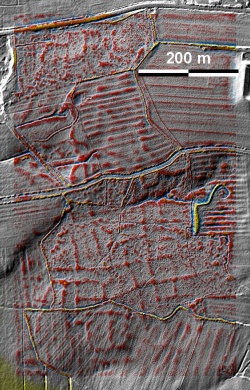
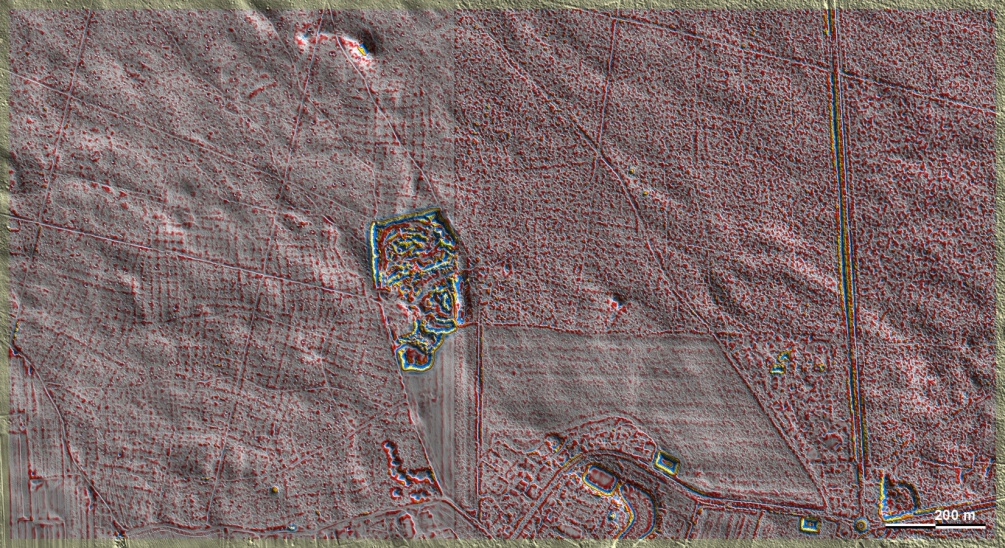
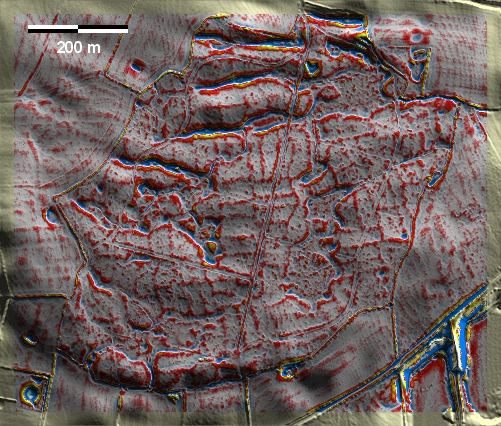
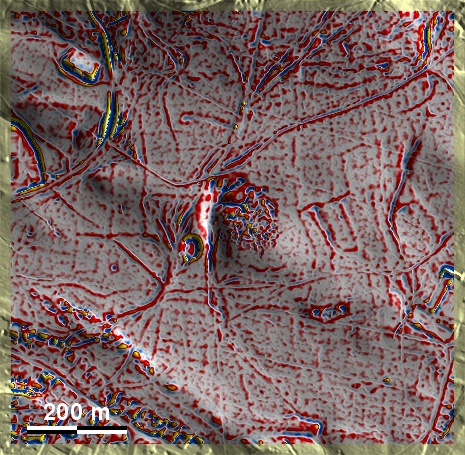
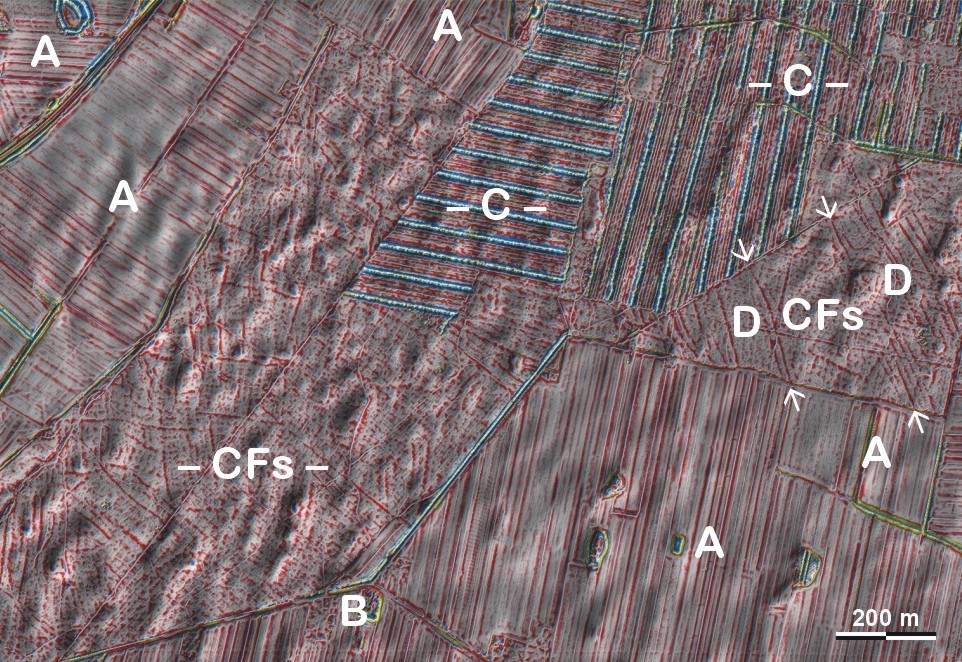
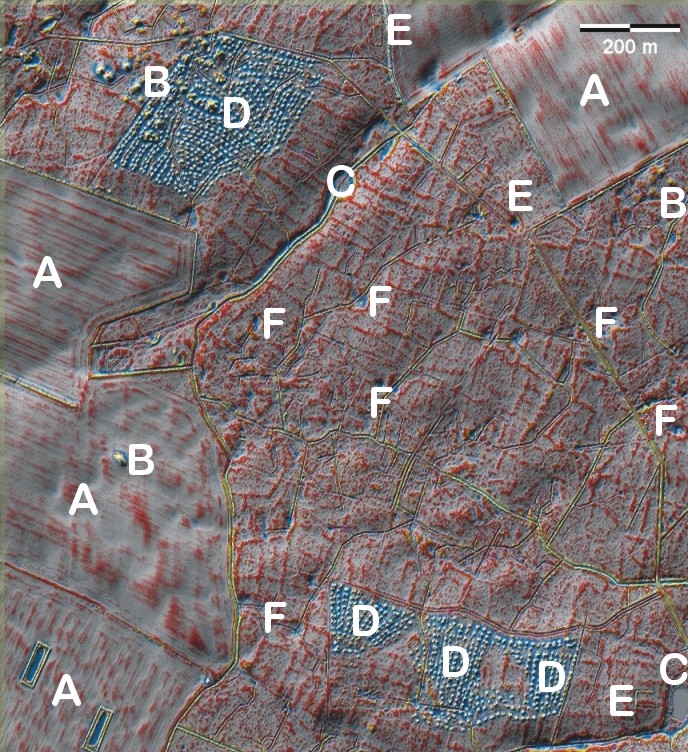
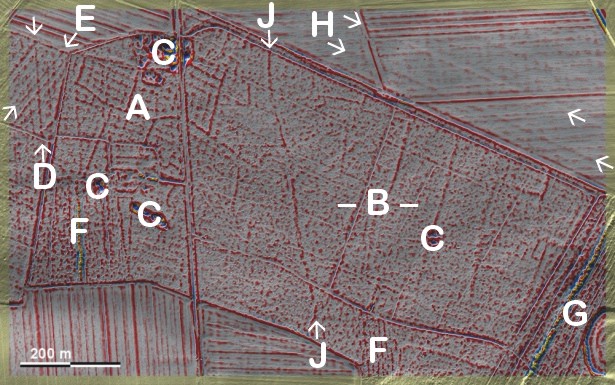
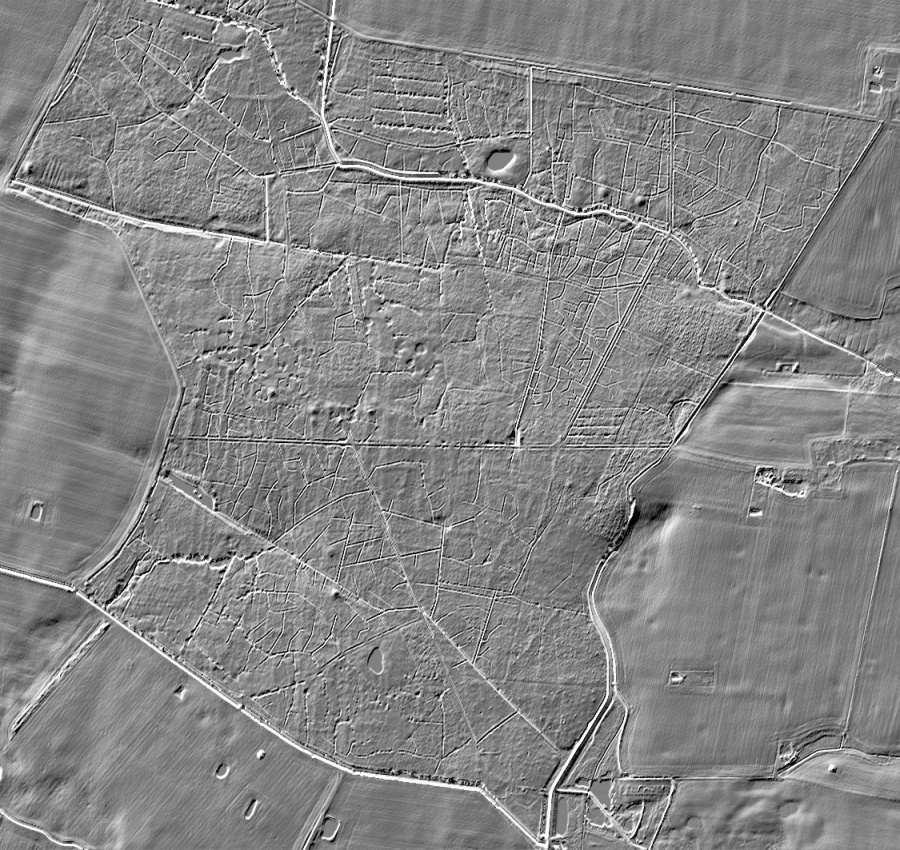
Example 1: The
Sackelberg bei Garsdorf,
Upper Palatinate Jura, Bavaria, Germany
|
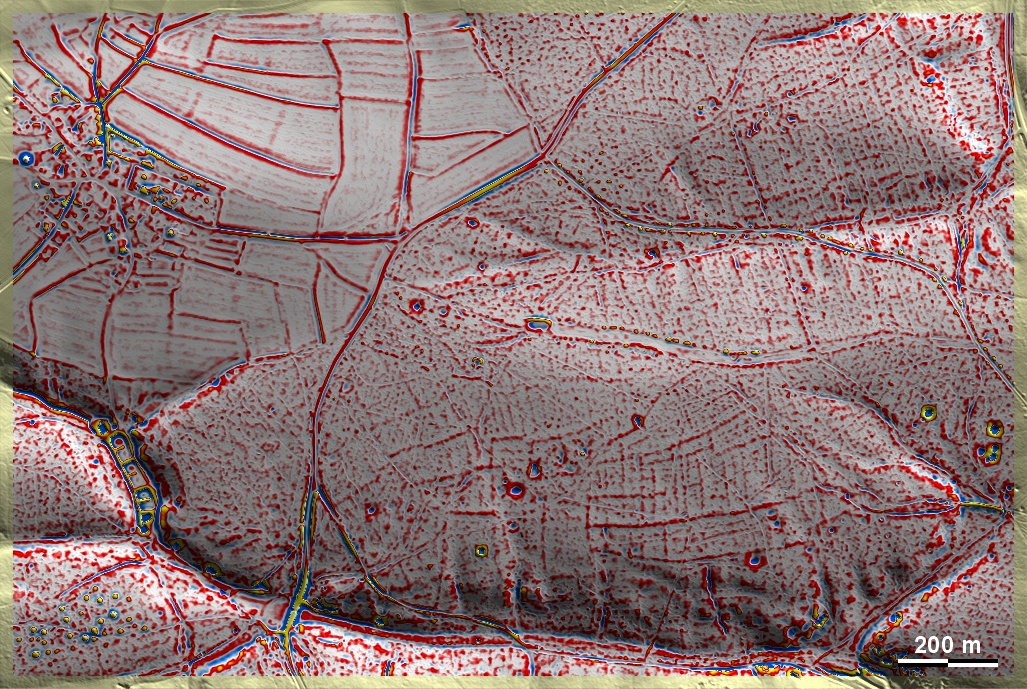 |
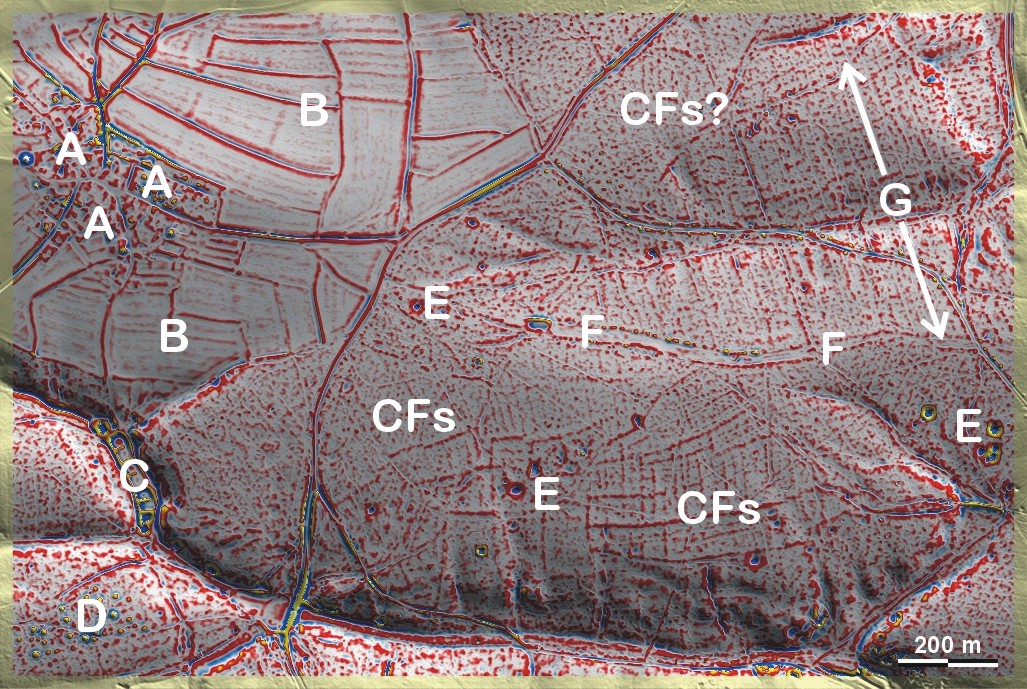
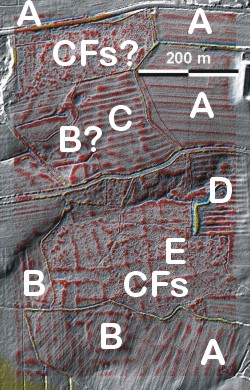
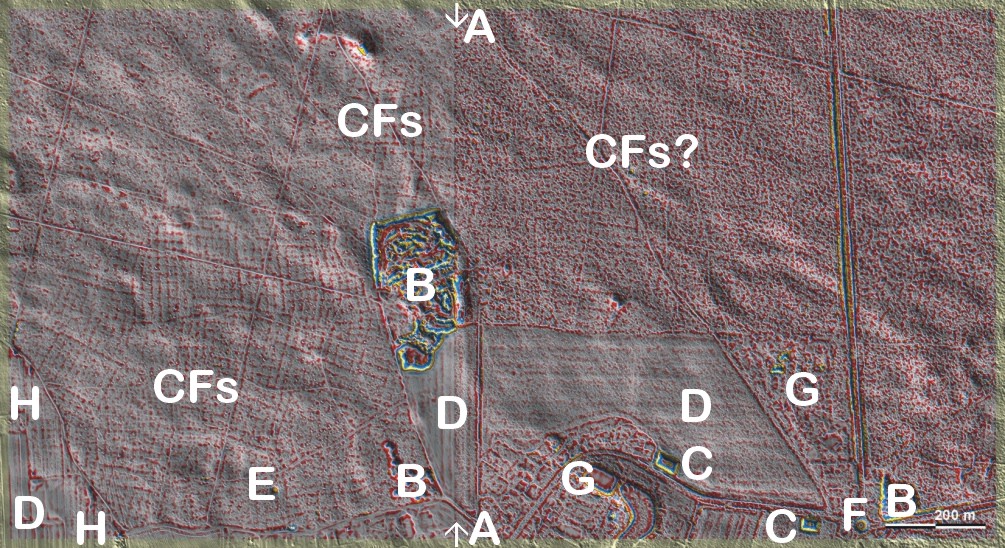
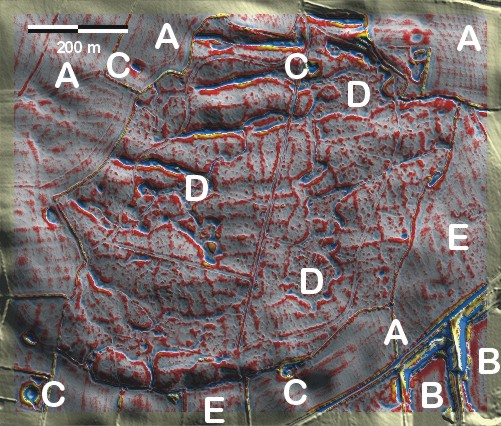
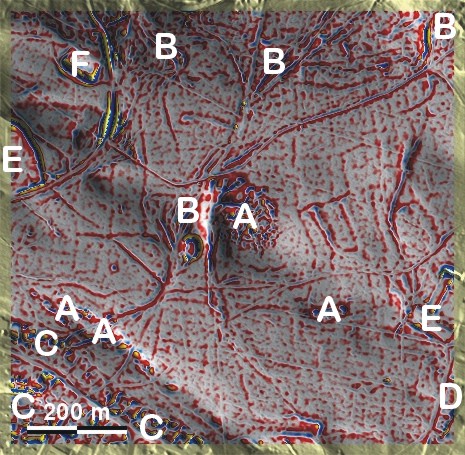
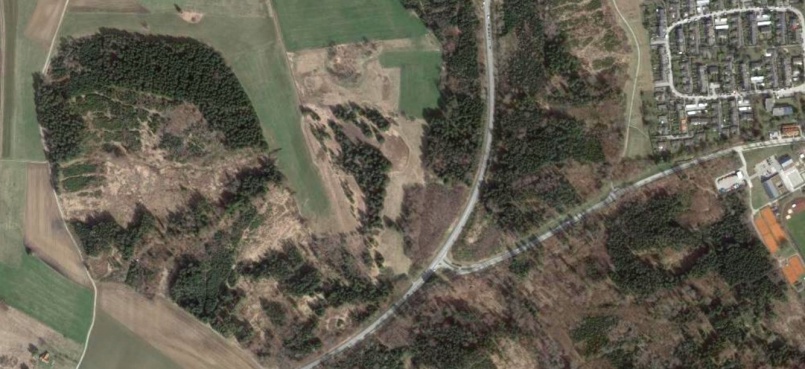
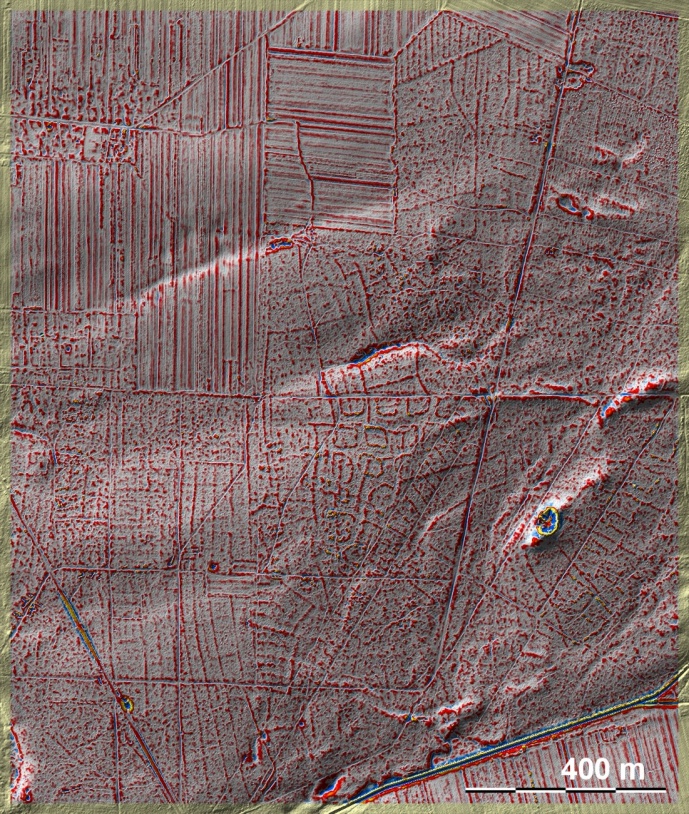
A: village (houses, gardens),
B: present-day farmland, C: ponds, CFs: 'Celtic Fields', D:
barrow group (better recognisable in relief view), E: small dolines
(over collapsed cavities in limestone bedrock), F: modern cut lane
(better recognisable in aerial photograph), G: orientation of
forestry logging tracks (better recognisable in relief graphic and
aerial photograph, deviating directions in the southeast). |
|
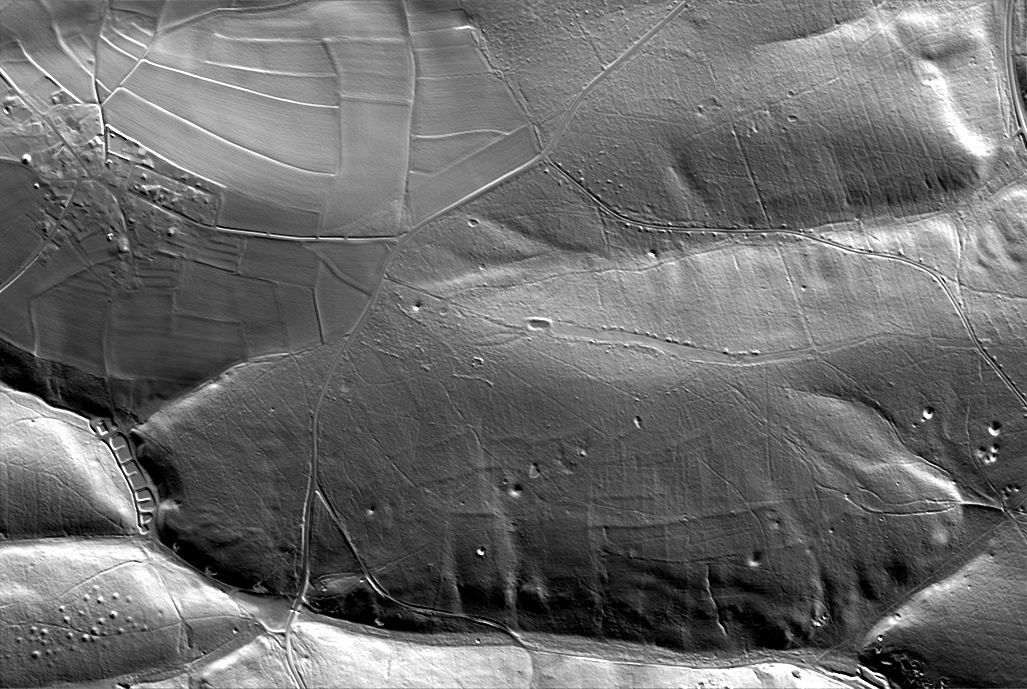 |
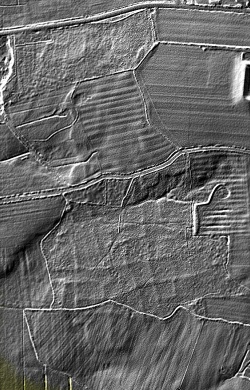
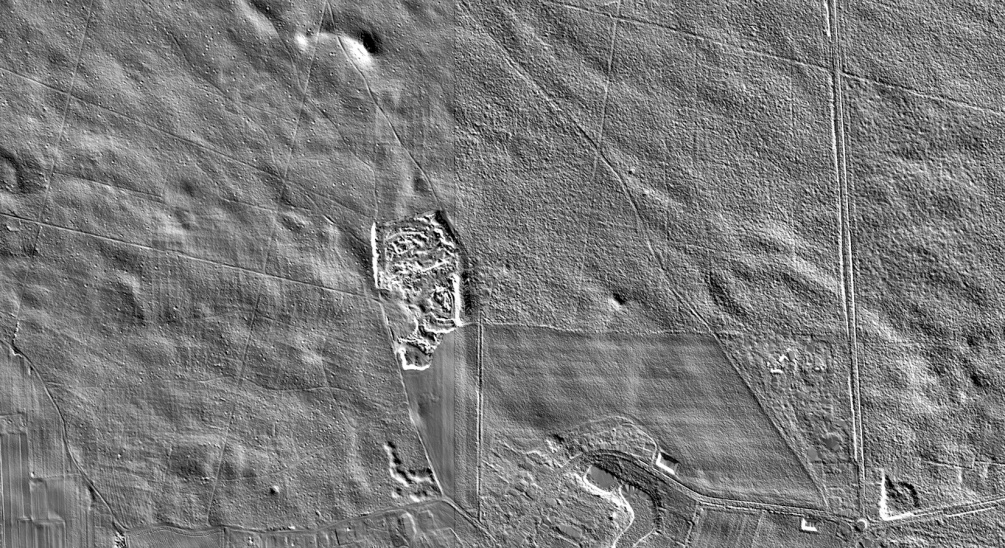
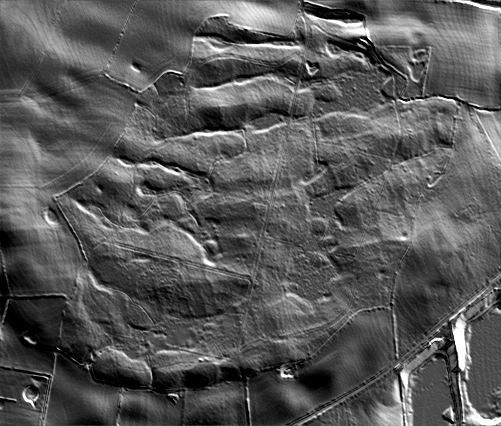
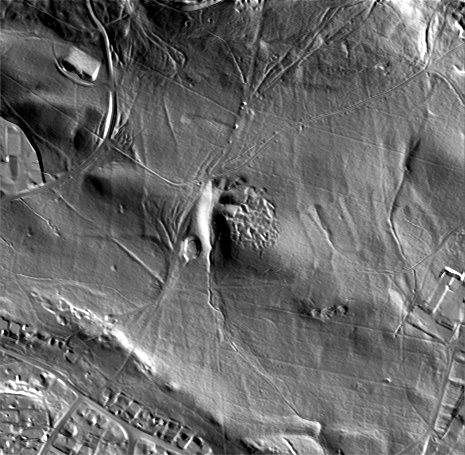
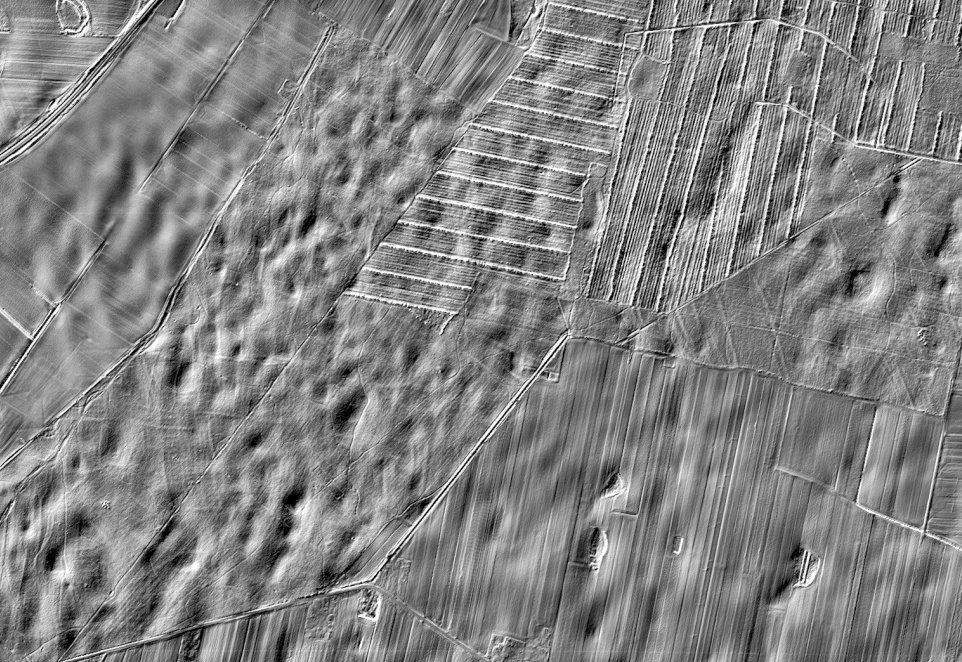
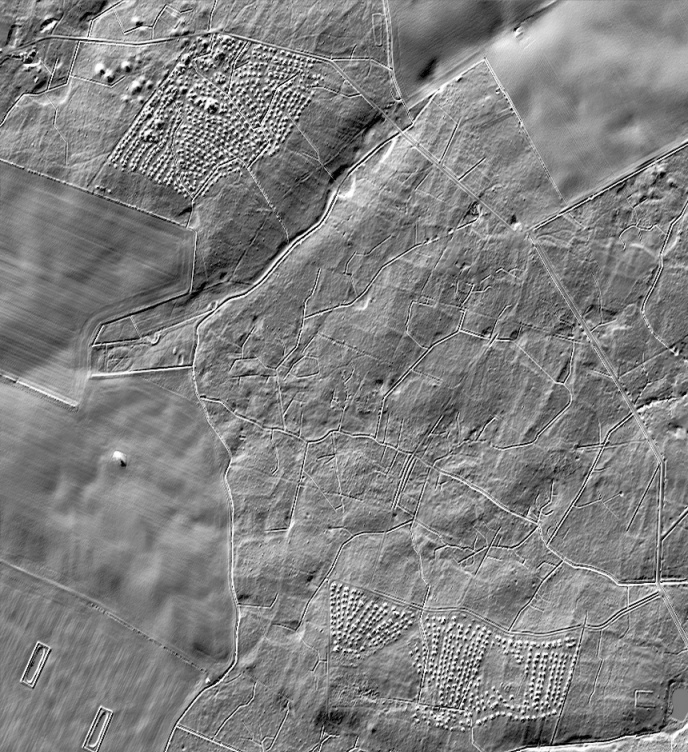
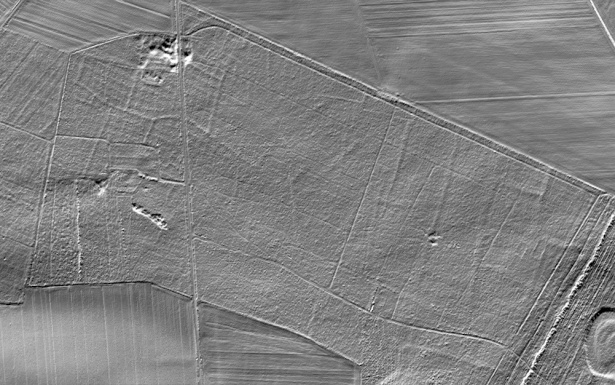
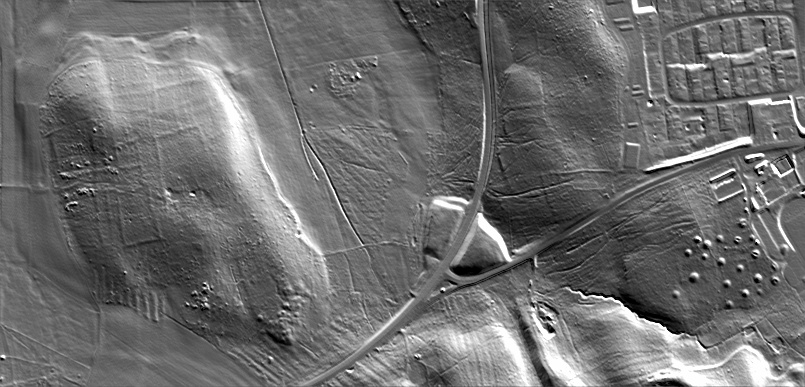
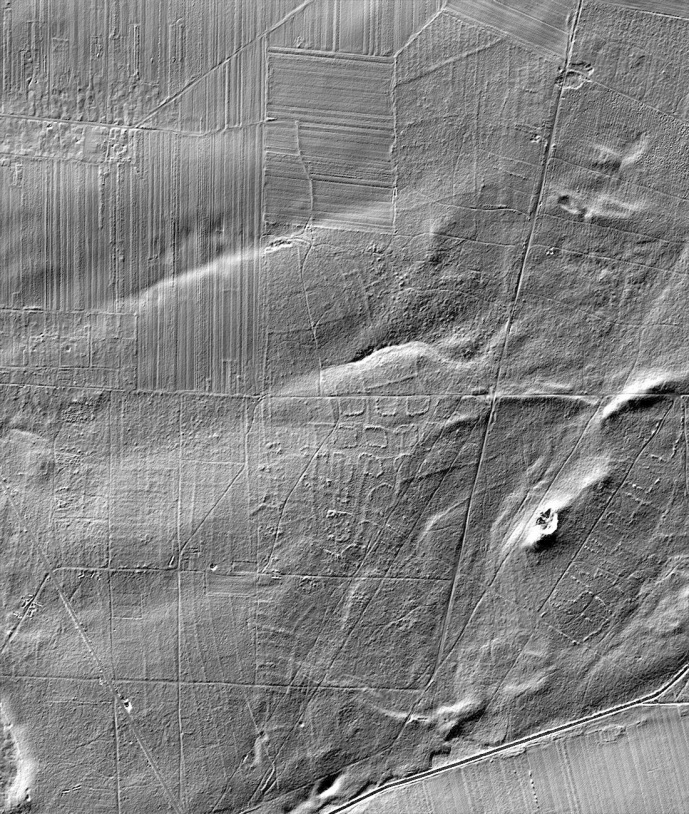
In the relief graphic, the burial
mounds are better recognisable than in the above graphic, which is
based on a difference map. The rows of earthen heaps along some of
the paths and the cut lane as well as the sinkholes are also clearly
visible. The 'Celtic Fields' can only be recognised well if the
lighting direction is suitable and they are well pronounced.
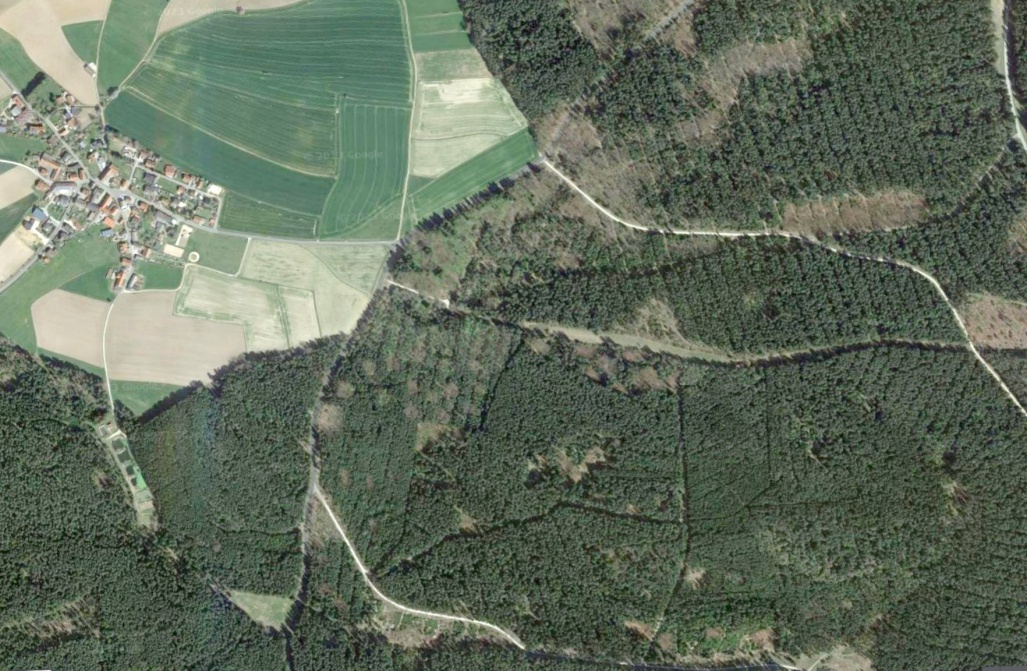
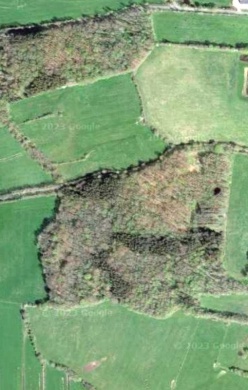
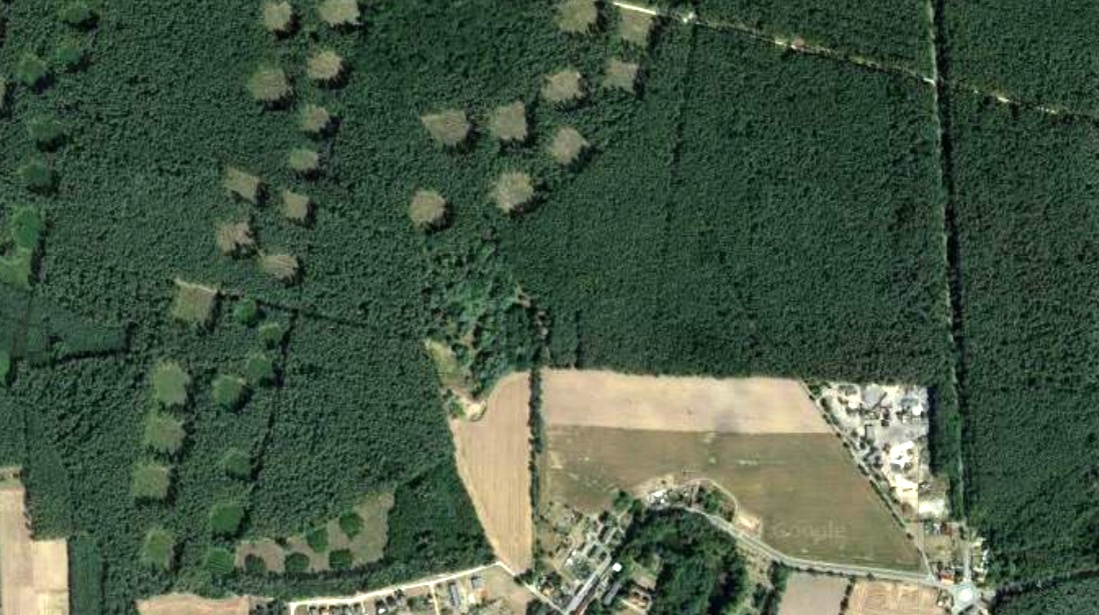
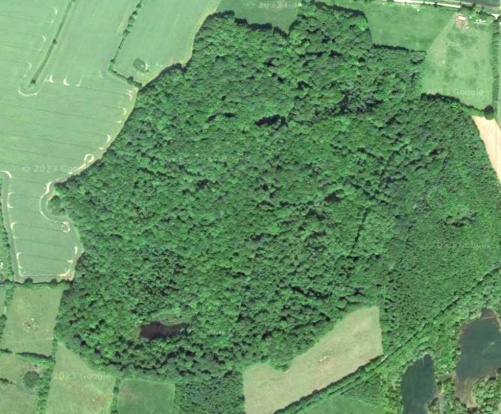
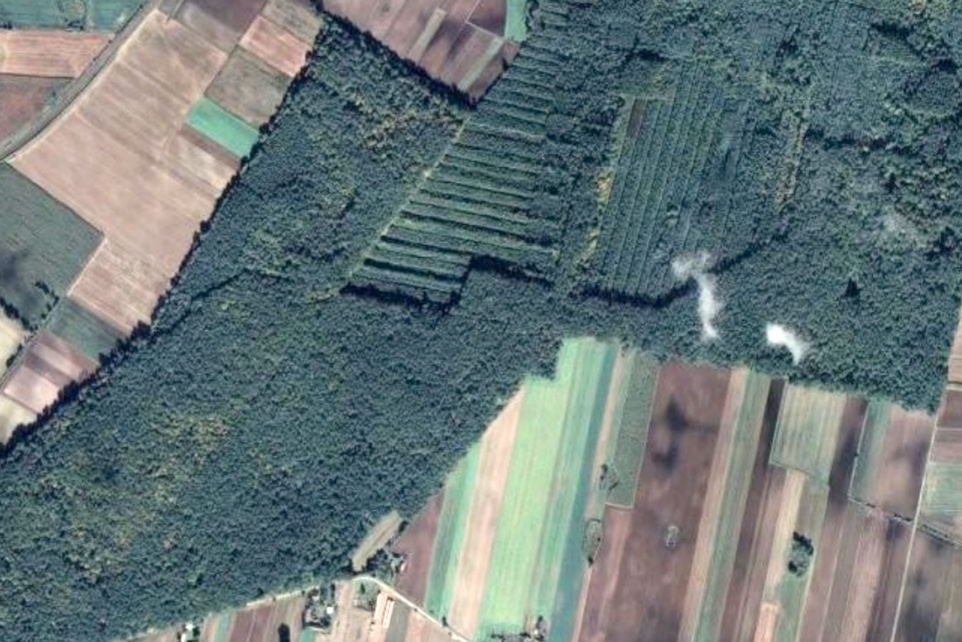
In the Google Maps aerial photo,
the houses, the forest outline and the paths and logging tracks in the
forest are particularly clear, as is the type and condition of the
forest cover.
 |
Example 2:
Odderade-West, Dithmarschen,
Schleswig-Holstein, Germany
|
 |
 |
 |
 |
|
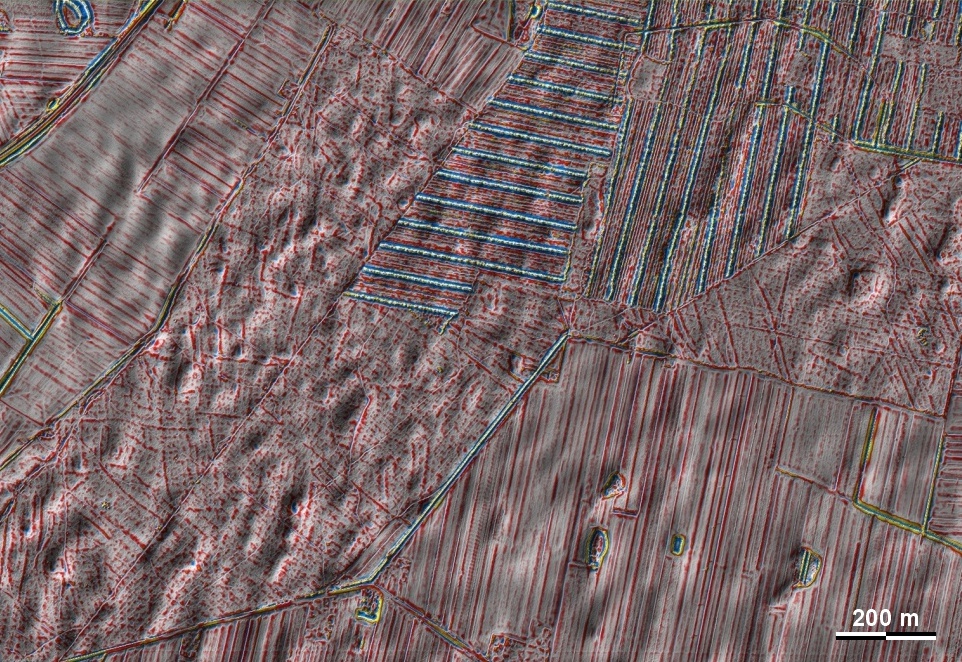
The traces of 'Celtic Fields'
are clearly visible in the southern of the two pieces of forest. The
forest is well distinguished from the surrounding farmland by the
'roughness' of the subsoil (increased data noise). A: Current
farmland, partly in grassland use, B: Grassland use, with certain or
questionable traces of 'Celtic Fields', C: Grassland over
ridge-and-furrow beds, D: Newly afforested ridge-and-furrow beds
with recent dam, E: Poorer data resolution over dense coniferous
forest. |
Example 3:
Brodziszewo-West / Lipnica-NW,
Wielkopolska, Poland
 |
A-A: Data break line, west good data
resolution, east poor data resolution in forest. B: material
extraction pits, C: artificial ponds, D: tilled, E: barrow, F:
modern mound as centre of a roundabout, G: houses/gardens, H:
new afforestation.
View in Google Maps. It is possible that the
view is more up-to-date than the laser data, because no traces
of clearing islands are visible there yet.
Relief view. To the west of
the data break line, not only are the chambered 'Celtic Fields'
of the Przemęt type clearly recognisable, including the edges of
the superior plots, but also a dense scatter of small pits,
probably from pit piles (which are not very clear in the above
diagram). East of the data break line, the edges of
superordinate plots can hardly be discerned, and the chambering
can at best be guessed at. Had only the eastern data been
available, the site would probably have been classified as
uncertain and unspecific. |
Example 4: Ratekau-Beutz, Schleswig-Holstein,
Germany
 |
A: present-day
farmland, B: gravel dredging lakes, C: marl hollows or
dead-ice holes, D: boggy drainless depressions, E modern
afforestation. On the areas of present-day farmland marked
A, wood grain-like traces are visible, which are due to
errors in the data compilation or are an undesirable effect
of the data preparation (shortly after 2006). In the forest,
these traces are almost completely lost in the data noise. |
 |
 |
Relief view. Here the
wood grain-like effects in the "smooth" farmland become
particularly clear.
The Google Earth aerial
photo shows the forest outline very clearly, but also the
difference between historically old forest and more recent
afforestation. |
 |
Example 5:
Erlangen-Meilwald, Bavaria, Germany
|
 |
 |
 |
|
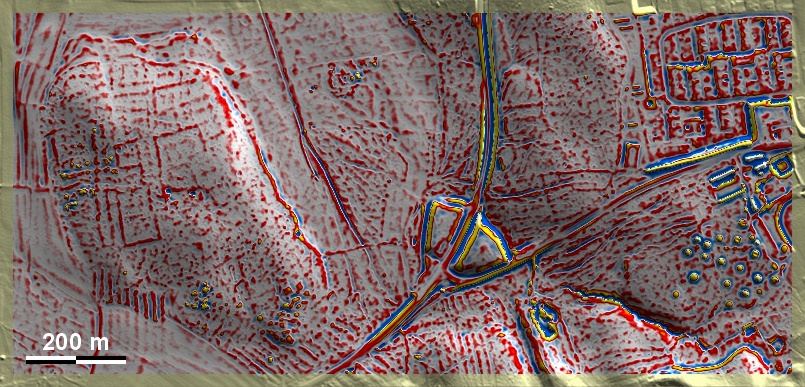
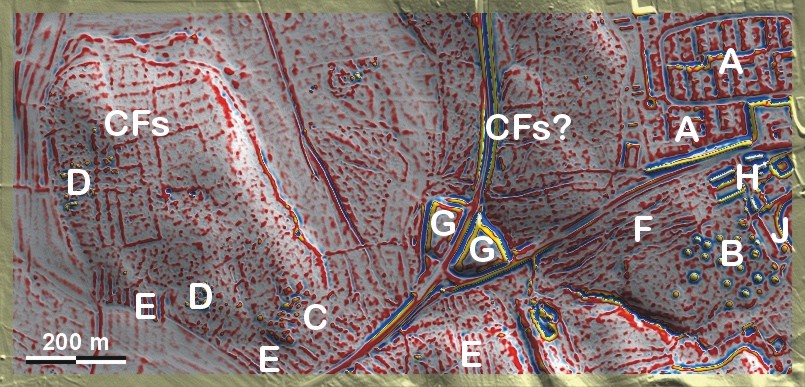
A: Material
extraction/mining traces, B Old path fans, C Houses/gardens, D
Dam ponds, E Buildings, F Fill. The faint 'Celtic Fields' are
only clearly recognisable in a few undisturbed forest areas. |
The relief graphic
illustrates the manifold disturbances of the wooded area close
to the city. Details of 'Celtic Fields' disappear. |
Example 6: Krynki-NW, Galicia, South-East Poland
|
 |
A: Today's farmland, B:
farmland, houses, C: forest that has lost all traces due to
extremely intensive forestry, CFs: narrowly chambered 'Celtic
Fields' of the Szczekotowo type, D: possibly fragments of
medieval long strip fields. The crucial area, where an
intercation between 'Celtic Fields' and longstriped land may
have taken place, seems to have been destroyed forever. |
|
 |
The relief graphic does not
provide any additional insights compared to the difference map
based graphic.
The extent of the extremely
soil-invasive forestry measures also becomes clear in the Google
Maps aerial photo. |
Example 7:
Grænge Skov, Falster,
Denmark
|
 |
A: Present-day farmland, B:
burial mounds / mound groups, C: (former) small lakes and ponds,
D: areas heavily disturbed by forestry activities (stump piles),
E: historic plantation areas / acorn gardens, F: natural
depressions, boggy, now drained. |
|
Bottom left: The same area using older laser data shows that the
forest disturbances are quite recent. However, these laser data
from 2007 are based on rather coarse point clouds, which results
in a considerably poorer resolution and recognisability of the
tracks in the forest. |
|
Below: The relief view once
again makes clear the severity of the forestry intervention. The
fact that the coordination between forestry and monument
preservation did not work here is already clear from the
half-affected (registered) group of burial mounds in the
northwest. ('Celtic Fields' are rarely registered and protected
in Denmark). |
|
 |
 |
Example 8:
Kamieniec-East, Wielkopolska, Poland
|
 |
A: chambered 'Celtic Fields' of the Przemęt type, B: faint
remnants of 'Celtic Fields', C: soil extraction pits, D: (with
directional arrows) traces of longstrip fields (?), E: (with
directional arrows) traces of forestry activities, F: disturbed
forest floor with stump wall, G: highly disturbed forest floor
with large stump wall, H: fault lines with slight data height
offset. |
 |
|
|
|
Example 9:
Feldafing-Schmälerholz, Bavaria,
Germany
|
 |
A: Houses, gardens, B: Hallstatt barrow
group, C: Barrow group, CFs: chambered 'Celtic Fields' of the
Przemęt type, D: Pseudo-structures due to lack of data
resolution or forestry chaos, E: Ridge-and-furrow beds under
forest, F: Old trail traces (fans), G Landfills, H: Buildings,
J: Sports area.
 |
|
 |
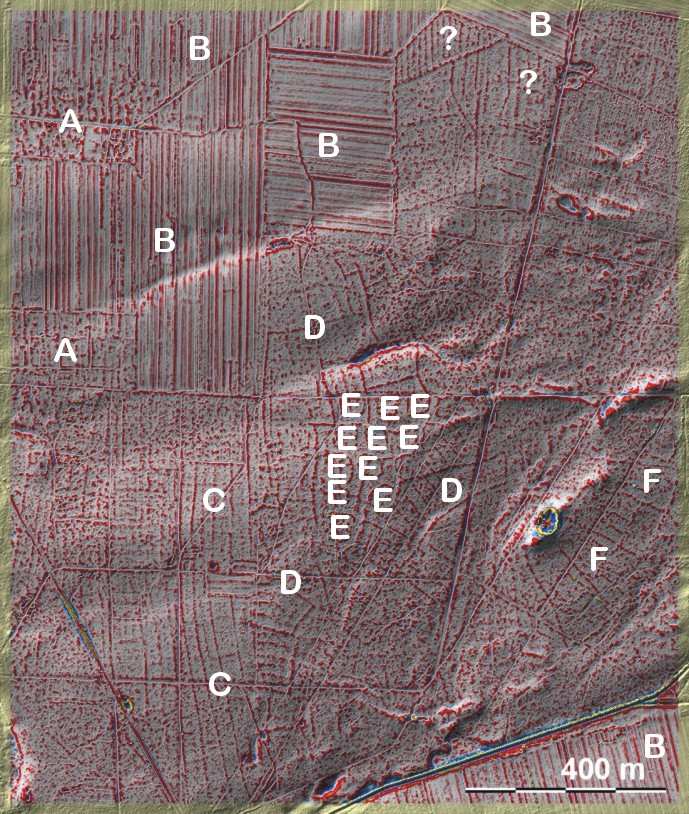
Example 10:
Kludno-Northeast, Central Poland
|
 |
 |
|
A: houses, gardens, B:
present-day farmland, C: fragmentary long strip fields (medieval?),
D: 'Celtic Fields' with hints of chambering, E: forest plant
islands, F: stump walls, ?: traces of unknown origin. The long strip
fields clearly cut across the 'Celtic Fields'.
In the relief graphic on the
left, the forestry stump walls can be distinguished much better from
the archaeological traces due to their "sharpness" than in the
graphics above.
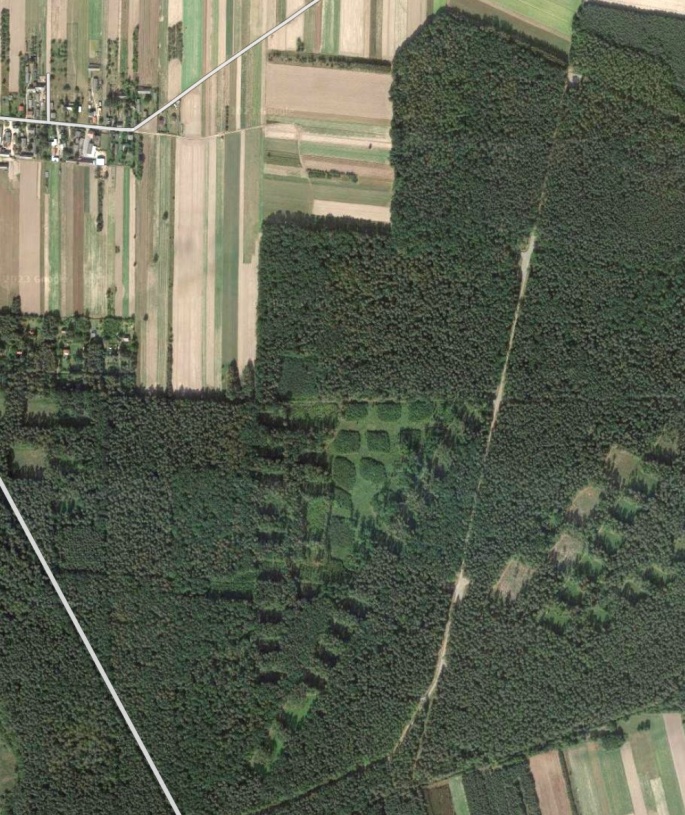
In the Google Maps aerial view
(down), the planting islands are particularly striking. |
|
 |
Example 11:
Errindlev-Keldskov, Lolland, Denmark
|
 |
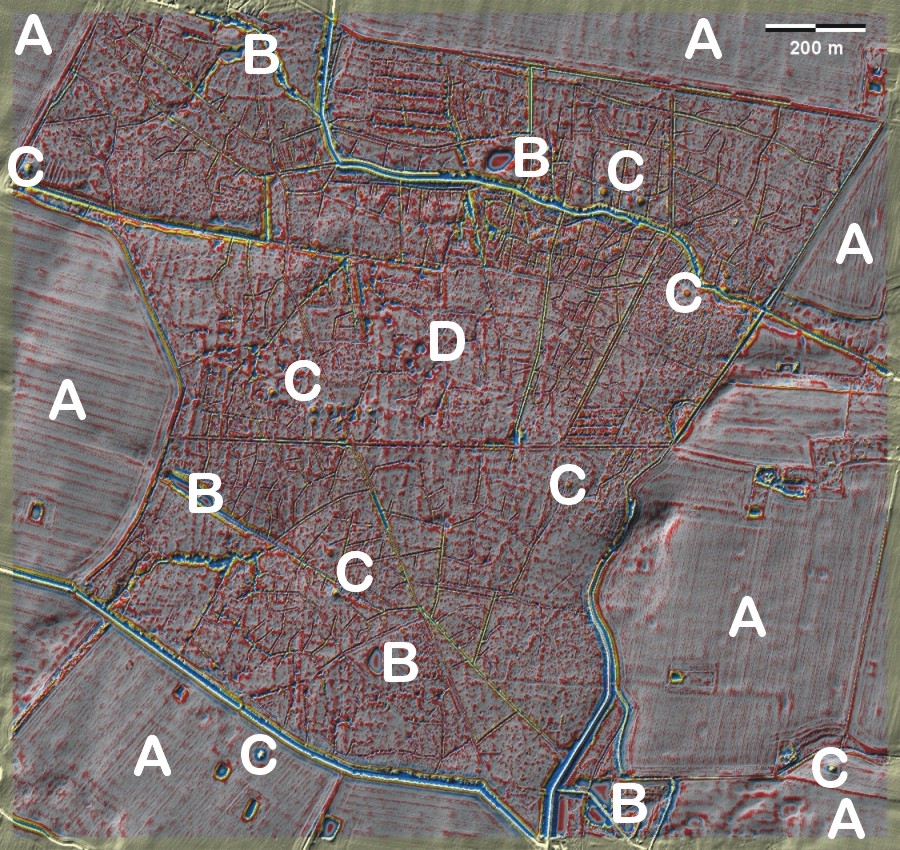
A: present-day farmland (with individual marl
pits or former watering places), B: constructed ponds, C: burial
mounds or groups inside and outside the forest, D: dead ice
holes?
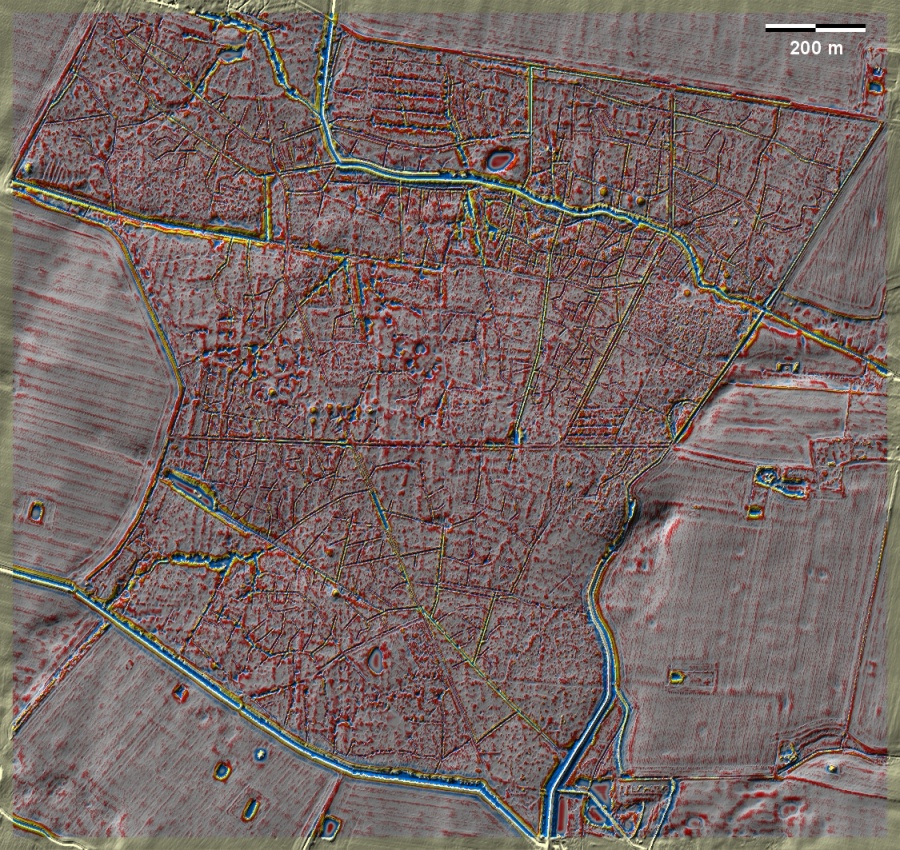
This forest was included here
because it is extremely intersected by modern drainage ditches,
which makes the graphic based on a difference map confusing.
In the relief view (below), the weak
archaeological traces stand out more clearly from the sharply
contoured drainage ditches. |
|
 |
More...
Back © Volker Arnold 2023